Information for Deans and Department Chairs
All courses at U of I (except Law and WWAMI) are evaluated each semester, in accordance with FSH 2700. Faculty can customize their course evaluation by adding up to 10 additional questions from an inventory, to each of their sections each term. Faculty are notified of this opportunity 7 days before the evaluation opens to students. Students are notified by email that they have evaluations to complete. Courses that are officially cross-listed or joint-listed in Banner, are automatically combined in reports. Courses that receive at least one evaluation and have two or more enrollments will be reported. Course responses that do not meet that criteria have their results withheld and are not viewable in MyCourseEval, to protect the identity of the students. Generally, reports are available for viewing in MyCoursEval on the morning after the final grade deadline.
Department chairs, program heads, and college/area administrators have access to data from completed faculty course evaluations, based on their administrative role. The video below provides a quick introduction for administrators of the MyCoursEval (from Anthology) platform, available Fall 2021. Promotion and Tenure reports are created outside the course evaluation system. Please see the Promotion/Tenure and Custom Reports section of this website for more information about how to request those reports.
MyCoursEval
Department Administrator Experience
Permissions
By default, all department chairs should have access to course evaluations for faculty in their department. Deans and associate deans should have access to course evaluations for faculty in their college. To request or change permissions, please complete this form.
Data Availability
There have been changes to the software used to collect course evaluation data from students. The questionnaire itself, did not change. Faculty and administrators can view system-generated reports, including some custom reports (in MyCoursEval), by logging into the system used during the semester you wish to view results for. Data has not been moved between these systems. Use the chart or the Data Locator Tool, to quickly locate the data or report you need.
Please see the Promotion/Tenure and Custom Reports section of this website for more information to request P&T reports. Please use the chart below to locate system-generated data and reports only.
| Semester(s) | Data Collection System | Changes to Data | Support |
|---|---|---|---|
| Fall 2021 and forward | MyCoursEval (Anthology) | Results are withheld when section enrollment is fewer than 2. Responses are on a scale of 1 to 5. | assessment@uidaho.edu |
| Summer 2020 to Summer 2021 | Course Evaluations (Anthology) | Results were withheld when student responses were fewer than 3. Responses were on a scale of 0 to 4. | assessment@uidaho.edu |
| Spring 2020 and earlier | Course Evaluations | Results were withheld when course enrollment was fewer than 5. Responses were on a scale of 0 to 4. | studeval@uidaho.edu |
MyCoursEval Administrator Reports
This view allows you to see all the departments you have access to and provides department level data at a glance. This includes:
- Number of reports
- Response rate
- Number of students that responded
You will also have the option to drill-down within the department, to the course level.
After you log in to MyCoursEval you will be placed on one of four landing pages.
- If you have surveys to take, you will see the My Surveys page.
- If you are directly affiliated with a recent course, you will see the My Reports page.
- If you are only affiliated to courses based on relationships to instructors, you will be placed on the Administrator View by Department for the specific courses you have access to.
- If you are affiliated with courses in your departments or college, you will see the Administrator View by Department page below.
You can switch between Surveys, Reports and Administrator Reports using the menu options in the upper left-hand corner.

Administrator View by Department
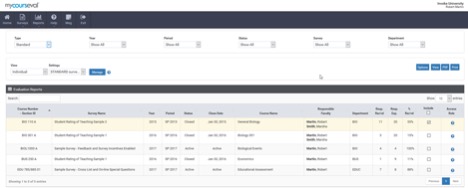
This page displays each department that you are associated with a roll-up of the total expected surveys and the number received.
You can click on the # Reports for a department to find a list of the individual reports included in the roll-up. Once expanded the list looks exactly like the report list found if you are teaching courses.

- The survey and course information are listed on the left of the list, features that are accessible on the right, and survey status in the middle.
- You will be able to view the status and progress of the survey, preview what survey participants will see, view the report when the results are available, and jump to the list of survey reports where you can view any report that you have ever had access to.
The search found in the left top of the list can be used to reduce the reports to those courses associated with the selected individual.
The search option by last name will help find reports for anyone who has been evaluated. This option searches all assessed individuals and filters the list where they are found.

Evaluation reports are the preferred view of evaluations for faculty. Department or college administrators can also view these reports for faculty within their area.
To view reports for a department or course, click the view report icon or go to the Reports menu to select the report you wish to view.
The search option by last name will help find reports for anyone who has been evaluated. This option searches all assessed individuals and filters the list where they are found.


This screen displays the faculty list for the year, term and survey selected in the drop-down menus.
There are two basic types of Evaluation Report views: Comparative and Individual. Select the type of report to view from the drop-down list labeled View.
- Comparative view: presents an overview of the performance of all individuals evaluated for each course.
- Individual view: presents the performance of each person assessed in separate sections of the report.
From this page, select one or more courses to view in the report. To view the report, check the box corresponding to the report and click View.
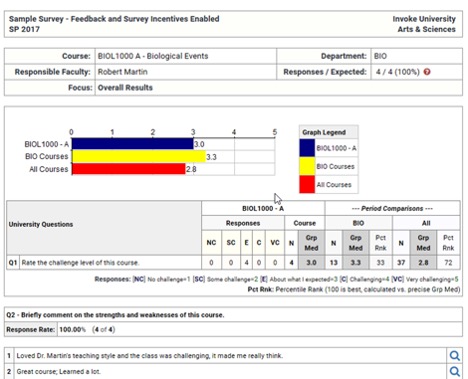
The default report view may provide a series of bar graphs and numerical results obtained for the selected course(s). If more than one course is selected from the reports page, they will be displayed in sequence scrolling down the page.

The default report may provide comparative results for a course, other courses in the department and all of the courses (campus wide) included in the evaluation period or just on this specific survey. Basic statistics are provided as well.
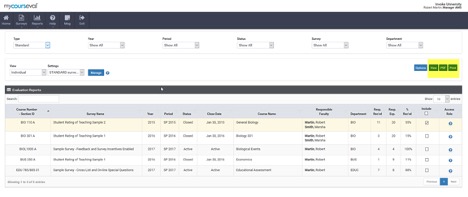
Reports may be printed by clicking the Print option located on the Evaluation Reports page or PDF can be created by clicking on the PDF option.

Survey Intelligence (SI) reports are custom reports created using a 7-step set-up that allows for various filtering, aggregating, ordering, layout/display options, and saving/publishing features. It is recommended that users have a clear goal in mind when designing reports so they can enjoy the feature’s full potential. A wizard is used to help build and configure these reports.

- Create or Select a Design
- Set the filters
- Select the surveys
- Choose the questions
- Setup data aggregations
- Design the layout
- Save the design
- View the report, save to PDF, or export the data to Excel
Configurable items include:
- School logo
- Custom Title
- Expected/received
- Questions
- Overall score
- Overall Graph
- Overall Score Scale
- Compare Overall Score - weighted or average
- Mean or Group Median
- Question Response Count
- Variation Statistic - None, Std Error, Std Dev, or Variance
- Frequency Distribution
- Median
- Group Questions By - Question, Category, or Sub-category
- Order Questions Alphabetically or Question Manager Order
MyCoursEval
Survey Intelligence Report


