2018 Farm Bill Agricultural Commodity Support Programs

Background
The 2018 Farm Bill was signed into law on December 20, 2018 (McMinimy 2019), under far different farm economic conditions than existed under enactment of the 2014 Farm Bill. Net farm income was lower compared to 2014 for each year from 2015 to 2018, with 2018 being the lowest (Economic Research Service 2019). Within this context of a challenging financial environment for many agricultural producers, federal funds for agricultural commodity support programs and crop insurance remain largely intact from their levels under the 2014 Farm Bill (McMinimy 2019).
Despite maintaining similar funding levels, a few administrative and payment criteria changes were made. The dairy support program under the 2014 Farm Bill, known as the Margin Protection Program (MPP), was replaced with the Dairy Margin Coverage (DMC) program. Besides a new title, the DMC has substantially lower premium rates if certain conditions are met, and some adjustments were made to the overall payment structure. The crop and livestock support programs retain their same titles, but several administrative and payment criteria changes were made in both. Notwithstanding adjustments in rules, the overall goal for the agricultural commodity support programs in the 2018 Farm Bill remains to provide farmers financial support during periods of adverse market conditions.
The goals for this bulletin are to
- describe the modifications to existing dairy, crop, and livestock federal agricultural support programs in the 2018 Farm Bill;
- provide descriptions of the 2018 Farm Bill crop commodity support programs within the context of the agricultural commodities produced in the Pacific Northwest (PNW) states of Idaho, Montana, Oregon, and Washington;
- inform of key dates regarding program sign-up;
- provide information on useful supplemental resources that will be helpful when making program decisions over the life of the 2018 Farm Bill through 2023.
Dairy
Dairy support program rules have been released by the United States Department of Agriculture (USDA) Farm Service Agency (FSA) and the program has been fully operational since June 17, 2019.
The DMC program protects dairy producers’ margin (income over feed costs). Similar to the MPP, the DMC program still uses the US All Milk price and subtracts from it a national formula for feed costs that includes prices for corn, soybean meal, and alfalfa. Tier 1 now covers up to 5 million lbs of milk produced and marketed and increases maximum margin coverage to $9.50/cwt, with the lowest margin coverage remaining at $4.00/cwt. For Tier 2, which covers over 5 million lbs of milk produced and marketed, the maximum margin coverage remains at $8.00/cwt.
Premiums are significantly reduced for coverage in Tier 1, and there is an additional five-year sign-up premium discount for Tier 1. If you select to cover your Tier 1 production at $8.50/cwt or above, you can choose to cover at a different level for the Tier 2 amount should you decide to do so. Conversely, if you choose coverage in Tier 1 at $8.00/cwt or less, you have to choose the same coverage level for Tier 2. Coverage at $4.00/cwt remains at $100 without premium payment for both Tier 1 and Tier 2. Covered production can now vary from 5% to 95% of the dairy’s production (marketed) history, which is the largest amount produced and marketed in 2011, 2012, or 2013. Once this (largest) production history is determined, it will remain the same until the next Farm Bill (there are no adjustments for production increases). However, the amount of coverage can vary each year from 5% to 95% (in increments of 5%) of the determined production.
Enrollment in this dairy program takes place at the local FSA office. Sign-up dates for future years will happen before the year begins (for example, sign-up for year 2021 will occur around fall 2020). Current information allows us to determine payments for six months of 2019, since the resulting margins from January ($7.99/cwt), February ($8.22/cwt), March ($8.85/cwt), April ($8.96/cwt), May ($9.00/cwt), and June ($8.63/cwt) are known. Therefore, payments are guaranteed for all six months when selecting coverage of $9.50/cwt or higher; or guaranteed for two months when selecting coverage of $8.50/cwt.
The left side of Table 1 below shows the cost of premiums for each tier and coverage level. In addition, dairy producers who participated in the previous MPP program at coverage levels above $4/cwt are eligible to receive part of this premium payment back, or credit it to the new DMC program.1 On the right side of Table 1 is the resulting margins for the first six months of 2019. Monthly margin payments for each coverage level indicate that indemnity payments at coverage levels of $9.50/cwt or above surpass the premium costs. That is, there was a net positive return in participating in 2019 for these coverage conditions.
| DMC Premium Rates ($/cwt) | DMC Actual Margin ($/cwt) | ||||||||
|---|---|---|---|---|---|---|---|---|---|
| Selected Coverage Level | Tier 1 (at or below 5 million lbs produced) | Tier 2 (above 5 million lbs produced) | 5-year Discount Tier 1 | Jan 7.99 |
Feb 8.22 |
Mar 8.85 |
Apr 8.96 |
May 9.00 |
Jun 8.63 |
| Actual Indemnity | |||||||||
| 4 | 0.00 | 0 | 0 | --- | --- | --- | --- | --- | --- |
| 4.5 | 0.0025 | 0.0025 | 0.0019 | --- | --- | --- | --- | --- | --- |
| 5 | 0.005 | 0.005 | 0.0038 | --- | --- | --- | --- | --- | --- |
| 5.5 | 0.03 | 0.10 | 0.0225 | --- | --- | --- | --- | --- | --- |
| 6 | 0.05 | 0.31 | 0.0375 | --- | --- | --- | --- | --- | --- |
| 6.5 | 0.07 | 0.65 | 0.0525 | --- | --- | --- | --- | --- | --- |
| 7 | 0.08 | 1.107 | 0.06 | --- | --- | --- | --- | --- | --- |
| 7.5 | 0.09 | 1.413 | 0.0675 | --- | --- | --- | --- | --- | --- |
| 8 | 0.1 | 1.813 | 0.075 | 0.01 | --- | --- | --- | --- | --- |
| 8.5 | 0.105 | --- | 0.0788 | 0.51 | 0.28 | --- | --- | --- | --- |
| 9 | 0.11 | --- | 0.0825 | 1.01 | 0.78 | 0.15 | 0.04 | --- | 0.37 |
| 9.5 | 0.15 | --- | 0.1125 | 1.51 | 1.28 | 0.65 | 0.54 | 0.50 | 0.87 |
| Note: Abbreviations are Dairy Margin Coverage (DMC), hundredweight (cwt), and pounds (lbs). The premium rate is the cost that the milk producer pays per cwt of production to be covered by the program. The indemnity is the difference between the selected coverage level and the actual monthly average margin. Source: USDA FSA (2019a). |
|||||||||
For example, assume Tom has a production history of 50 million lbs/year. He wants to take advantage of the lower premium of Tier 1 and insure at the highest level $9.50/cwt, since he already is guaranteed payment in the first six months of 2019. In addition, he insures the rest at $5.00/cwt in Tier 2, given the premium there is half a cent per cwt ($0.005/cwt). Therefore, he insures 95% of his 50 million lbs (500,000 cwt) which is equal to insuring 475,000 cwt.2
- For Tier 1, for which only up to 50,000 cwt of production can be covered, the cost of yearly coverage for 9.50 $/cwt is 0.15 $/cwt x 50,000 cwt = $7,500.
- For Tier 2, for which there is no maximum level of production that can be covered, the cost of yearly coverage for 5.00 $/cwt is 0.005 $/cwt x 425,000 cwt = $2,125.
The program assumes equal amounts of monthly production:
- For Tier 1: 50,000 cwt/12 = 4,167 cwt/month
- For Tier 2: 425,000 cwt/12 = 35,417 cwt/month
Indemnity Payments for each month are defined as
(Chosen Margin level – Announced Margin level) x monthly cwt covered
Since all Announced Margin levels are below the Chosen Margin level at Tier 1, indemnity payment would be approximately
January: (9.50 – 7.71) x 4,167 = $7,459
February: (9.50 – 7.91) x 4,167 = $6,625
March: (9.50 – 8.66) x 4,167 = $3,500
April: (9.50 – 8.82) x 4,167 = $2,834
May: (9.50 – 9.00) x 4,167 = $2,083
June: (9.50 – 8.63) x 4,167 = $3,625
Therefore, total payments up to June’s Announced Margins would be $26,126.
Subtracting the premiums of $9,625 and the administration fee of $100 shows that so far for 2019 Tom would have a net gain of $16,401 from participation in the DMC program.
Three remaining things to consider:
A DMC decision tool developed by the University of Wisconsin provides an assessment of the current and future chances of receiving a payment. It permits the input of different production and coverage scenarios and provides the results according to estimated forecasts. This useful tool is located at https://www.fsa.usda.gov/programs-and-services/farm-bill/farm-safety-net/dairy-programs/dmc-decision-tool/index.
Another new program available for risk management is the Dairy Revenue Protection (DRP) program, offered through the USDA Risk Management Agency (RMA) by local insurance agents. Participating in the DMC program does not exclude participation in the new DRP program or the already established Livestock Gross Margin (LGM)-Dairy program.
The DMC payments may be reduced by a small percentage (6.2% for 2019) due to a sequester order from Congress. More details on this and any other DMC-related information is available at https://www.fsa.usda.gov/programs-and-services/dairy-margin-coverage-program/index.
Crops
The agricultural commodity support programs for crops for the 2018 Farm Bill retain the same names from the 2014 Farm Bill: Price Loss Coverage (PLC), Agricultural Risk Coverage-County (ARC-CO), and Agricultural Risk Coverage-Individual (ARC-IC). All are administered by the FSA. There are twenty-eight “covered” commodity crops that are eligible for enrollment under PLC and ARC, so long as the farm meets progam eligibility criteria. Producers can make an election for coverage of all or some crops on their farm.
In a broad sense, PLC provides coverage if a covered commodity’s national marketing year average (MYA) price falls below its statutory reference price; ARC-CO provides coverage if county revenue from a crop is less than the county ARC-CO statutory guarantee for that crop year; and ARC-IC provides coverage if farm revenue from all crops on a farm is below the ARC-IC statutory guarantee. The PLC statutory reference prices and the statutory guarantee revenue rules for ARC-CO and ARC-IC are established within the 2018 Farm Bill and are available in McMinimy (2019). Payments are made according to base acres for covered commodities rather than actual planted acres (Effland et al. 2014).
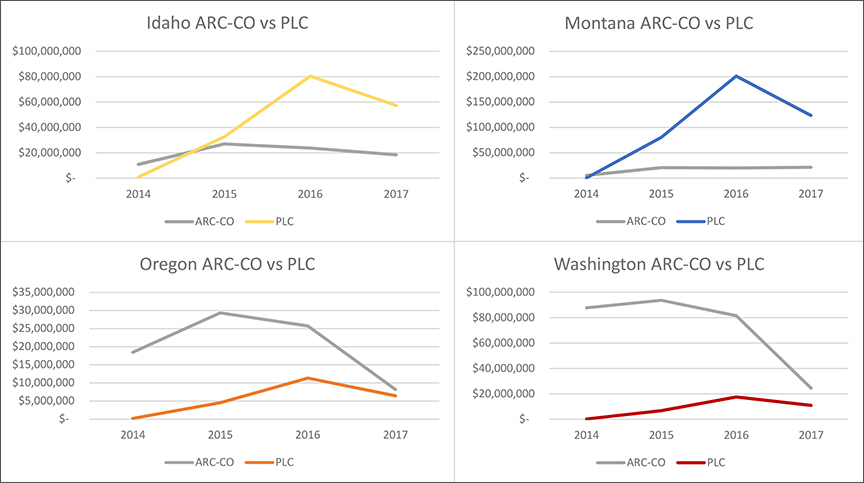
Total ARC-CO and PLC payments for all covered crops grown in the PNW states for 2014–17 are included in Figure 1. Idaho and Montana had considerably more PLC than ARC-CO payments in all years except 2014. The opposite was observed for Oregon and Washington, where ARC-CO payments predominated. These data imply that the MYA prices for covered crops were further below the reference price level in 2016 and 2017 than in 2014 and 2015. Additionally, the amount of payments for revenues below the county averages was lower in 2016 and 2017 relative to the 2015 levels, with especially pronounced drops observed in Oregon and Washington.

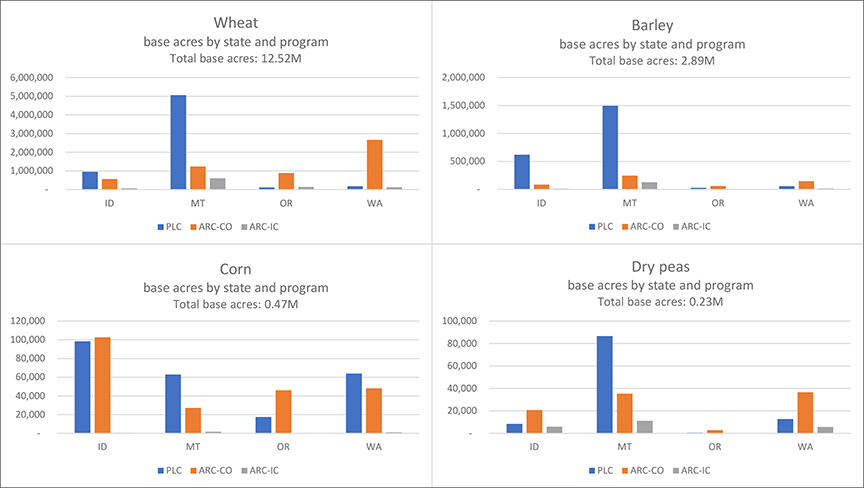
Regarding the base acres for covered crops, there are more similarities among the PNW states concerning which crops are most commonly covered, as is observed in Figure 2. Wheat predominates in all states. However, there are substantial barley base acres in Idaho and Montana, and there are more corn base acres in Idaho than in the other states. For total base acres, Montana has the most, followed by Washington, Idaho, and Oregon. While base acres are relatively small for the other covered commodities, they may be substantial for a given county depending on the region of observation.

Summary of key changes to ARC and PLC programs in the 2018 Farm Bill:
- Producers now make program selections in 2019 for the 2019 and 2020 crop years, and then annually for the 2021–23 crop years (McMinimy 2019).
- The farm owner has a one-time opportunity to update PLC program yields for the 2020–23 program years (McMinimy 2019). The yield update deadline is September 30, 2020.
- The definition of an individual “actively engaged in farming” now includes first cousins, nieces, and nephews for purposes of calculating total per farm payment limits (FSA 2019b).
- For the ARC program, RMA will be the primary source of county yield data. The USDA National Agricultural Statistics Service (NASS) or historical county yields will be used if RMA data are unavailable (McMinimy 2019).
- Marketing loan rates were increased for many crops grown in the PNW, including wheat, barley, corn, lentils, oats, and dry peas (Congressional Research Service 2019).
- The price used in PLC payments may be above the statutory reference price, but only up to 115% of the statutory reference price level (McMinimy 2019).
- The benchmark yield used in ARC revenue guarantee now has a floor of 80% of the historical Olympic average county yield (McMinimy 2019).
Crop commodity program decision aids, developed by Texas A&M University and the University of Illinois, to help farmers make program decisions during the 2014 Farm Bill enrollment period have been updated for the 2018 Farm Bill. The specific names of each are the “Texas A&M University 2018 Farm Bill Decision Aid” and the “University of Illinois FarmDoc Gardner Program Payment Calculator.” Each has been updated according to the 2018 Farm Bill rules issued by the FSA, USDA national marketing year average prices, and requisite county level RMA data. They will be continually updated as new data become available. The Texas A&M 2018 Farm Bill Decision Aid also has a segment that allows for determination of whether or not to update PLC program yields. Producers and farmland owners are encouraged to use these decision aids to help decide whether to update PLC program yields and to plan program elections for the 2021–23 crop years.

Livestock
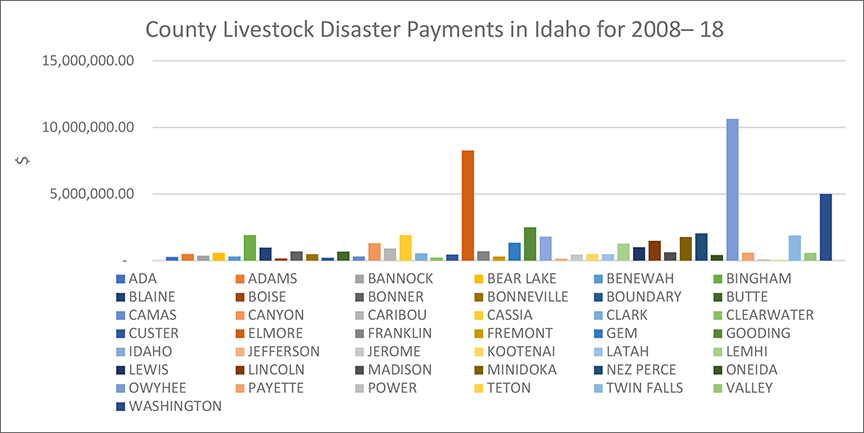
The 2018 Farm Bill expanded on the indefinitely extended livestock disaster programs established under the 2014 Farm Bill. A critical change in the 2018 Farm Bill is that payment caps per legal entity were removed for all livestock disaster programs, except for the Livestock Forage Program (LFP). However, limits in adjusted gross income (AGI), which are operational when an individual or entity has greater than $900,000 of AGI in a calendar year, remain in place for all livestock disaster programs (McMinimy 2019). Figure 3 shows total payments for livestock disaster payments for Idaho counties from 2008–18. While most counties had relatively low payment levels, the highest payments were made in counties with substantial rangeland area, namely Elmore, Owyhee, and Washington Counties.
In addition to the LFP, the other two principle livestock disaster programs are the Livestock Indemnity Program (LIP) and the Emergency Assistance for Livestock, Honeybees, and Farm-Raised Fish Program (ELAP).
The LFP provides compensation to eligible livestock producers that have suffered grazing losses due to drought or fire on land that is native or improved pastureland with permanent vegetative cover, or land that is planted specifically for grazing. Under the 2018 Farm Bill, LFP payments remain limited to a maximum of $125,000/crop year for each person or legal entity (McMinimy 2019). To sign up for LFP, eligible livestock producers need to report their losses to the local FSA office within thirty days after the calendar year (i.e., before January 31 of the next year) during which the losses occurred (FSA 2018b).
The LIP provides benefits to livestock producers for livestock deaths in excess of normal mortality caused by adverse weather or from attacks by animals reintroduced into the wild by the federal government. Effective with the 2018 Farm Bill, there is no longer a per person and legal entity payment limitation for LIP. However, an individual or legal entity is ineligible for payment under LIP if the AGI of the individual or entity exceeds $900,000. An owner or contract grower must file a notice of loss within thirty calendar days of this loss as well as file an application for payment within sixty calendar days after the end of the calendar year in which the eligible loss condition occurred (FSA 2018c).
For Idaho, a vast majority of the livestock disaster payments observed in Figure 3 were made under the LFP, as is shown in Table 2. According to the Idaho Rangeland Resource Commission (IRRC), there were a higher number of livestock losses due to wolf depredation in 2017, resulting in large LIP payments relative to other years (IRRC 2018).
| Year | LFP | LIP | ||
|---|---|---|---|---|
| Number of Payments | Total Payment Amounts | Number of Payments | Total Payment Amounts | |
| 2011 | 0 | $0 | 0 | $0 |
| 2012 | 171 | $1,802,736 | 2 | $89,445 |
| 2013 | 753 | $11,979,813 | 17 | $344,526 |
| 2014 | 549 | $10,443,673 | 12 | $21,792 |
| 2015 | 1,497 | $14,362,931 | 14 | $474,111 |
| 2016 | 214 | $2,646,396 | 5 | $42,432 |
| 2017 | 75 | $160,304 | 88 | $1,914,910 |
| 2018 | 129 | $659,767 | 17 | $193,007 |
| Note: Abbreviations are Livestock Forage Program (LFP) and Livestock Indemnity Program (LIP). Total payments are the sum of payments across all applicants. Data are updated as of August 2018. Source: USDA FSA DAP. |
||||
The USDA’s ELAP provides emergency assistance for losses due to disease (including cattle tick fever), adverse weather, or other conditions, such as blizzards and wildfires, not covered by LFP or LIP. Under the 2018 Farm Bill, the payment rate may vary, and will be a minimum of 60% for livestock, fish, and honeybee feed losses and 75% for honeybee colony and hive losses, fish deaths, and livestock deaths. For socially disadvantaged, limited-resource, and beginning farmers, the payment rate will be 90%, independent of funding constraints. For livestock feed losses, ELAP payments will continue to be based on producers’ actual costs (FSA 2018a).
Key upcoming decision dates
- September 30, 2020: deadline for the farmland owner to update PLC yields if desired.
- Annual elections for ARC and PLC programs for 2021–23 crop years.
Endnotes
1More details are provided at: https://www.fsa.usda.gov/news-room/news-releases/2019/usda-announces-repayment-options-for-producers-with-coverage-in-previous-margin-protection-program-for-dairy. (return to text)
2Tom could decide to only insure at Tier 1 level, which would be at 10% coverage level of his production or 50,000 cwt. This would save his premium payments for coverage at Tier 2 ($2,125) and still assure him of being covered at $4.00/cwt for Tier 2. He may also decide to take advantage of signing up directly for five years and obtain 25% off his premium costs. (return to text)
References
Congressional Research Service. 2019. “2018 Farm Bill Primer: Title I Commodity Programs.” CRS Report IF11164 (April 3). Congressional Research Service. Washington, DC. https://fas.org/sgp/crs/misc/IF11164.pdf.
Economic Research Service. 2019. “2019 Farm Sector Income Forecast.” Economic Research Service. Washington, DC. https://www.ers.usda.gov/topics/farm-economy/farm-sector-income-finances/farm-sector-income-forecast/.
Effland, A., J. Cooper, and E. O’Donoghue. 2014. “2014 Farm Act Shifts Crop Commodity Programs Away from Fixed Payments and Expands Program Choices.” Economic Research Service. Washington, DC. https://www.ers.usda.gov/amber-waves/2014/july/2014-farm-act-shifts-crop-commodity-programs-away-from-fixed-payments-and-expands-program-choices/.
FSA. 2018a. “Emergency Assistance for Livestock, Honeybees and Farm-Raised Fish Program: Fact Sheet.” Farm Service Agency report. United States Department of Agriculture. Washington, DC. https://www.fsa.usda.gov/Assets/USDA-FSA-Public/usdafiles/FactSheets/2018/elap_fact_sheet_april2018.pdf.
FSA. 2018b. “Livestock Forage Disaster Program: Fact Sheet.” Farm Service Agency report. United States Department of Agriculture. Washington, DC. https://www.fsa.usda.gov/Assets/USDA-FSA-Public/usdafiles/FactSheets/2018/livestock_forage_disaster_program-july2018.pdf.
FSA. 2018c. “Livestock Indemnity Program: Fact Sheet.” Farm Service Agency report. United States Department of Agriculture. Washington, DC. https://www.fsa.usda.gov/Assets/USDA-FSA-Public/usdafiles/FactSheets/2018/livestock_indemnity_program_fact_sheet_dec_2018.pdf.
FSA. 2019a. “Dairy Margin Coverage Program: Fact Sheet.” Farm Service Agency report. United States Department of Agriculture. Washington, DC. https://www.fsa.usda.gov/Assets/USDA-FSA-Public/usdafiles/FactSheets/2019/dairy_margin_coverage_program-june_2019_fact_sheet.pdf.
FSA. 2019b. “The 2018 Farm Bill—What is New and What Has Changed.” Farm Service Agency report. United States Department of Agriculture. Washington, DC. https://www.farmers.gov/sites/default/files/documents/FSA-FarmBill2018_WhatsChanged-19.pdf.
FSA ARC/PLC. “ARC/PLC Program.” Farm Service Agency. United States Department of Agriculture. Washington, DC. https://www.fsa.usda.gov/programs-and-services/arcplc_program/index.
FSA Disaster Assistance Program. “Disaster Assistance Programs.” Farm Service Agency. United States Department of Agriculture. Washington, DC. https://www.fsa.usda.gov/programs-and-services/disaster-assistance-program/.
IRRC. 2018. “Wolf Depredation Cases Escalate to Record Levels in Idaho.” Idaho Rangeland Resources Commission (July 24). Emmett, ID. https://idrange.org/press-release/wolf-depredation-cases-escalate-to-record-levels-in-idaho/.
McMinimy, M.A. 2019. “The 2018 Farm Bill (P.L. 115-334): Summary and Side-by-Side Comparison.” CRS Report R45525 (February 22). Congressional Research Service. Washington, DC. https://fas.org/sgp/crs/misc/R45525.pdf.
About the Authors
Patrick L. Hatzenbuehler — Extension Specialist, Crops Economics, University of Idaho (UI) Twin Falls Research and Extension Center
Hernan Tejeda — Extension Specialist, Dairy and Livestock Economics, UI Twin Falls Research and Extension Center
Ashlee Westerhold — Area Extension Economist, UI Twin Falls Research and Extension Center
Acknowledgments
Funding support for this bulletin was provided by the Northeast Extension Risk Management Education Center, which allowed several of the authors to attend the 2018 Farm Bill Education Conference in Kansas City, MO, May 22–23, 2019.
Pacific Northwest Extension Publications
Pacific Northwest Extension publications are produced cooperatively by the three Pacific Northwest land-grant universities: Washington State University, Oregon State University, and the University of Idaho. Similar crops, climate, and topography create a natural geographic unit that crosses state lines. Since 1949, the PNW program has published more than 700 titles, preventing duplication of effort, broadening the availability of faculty specialists, and substantially reducing costs for the participating states.
Pacific Northwest Extension publications contain material written and produced for public distribution. You may reprint written material, provided you do not use it to endorse a commercial product. Please reference by title and credit Pacific Northwest Extension publications.
Order Information
University of Idaho Extension
https://www.uidaho.edu/extension/publications
208-885-7982 | 208-885-9046 (fax) | calspubs@uidaho.edu
Washington State University Extension
https://pubs.extension.wsu.edu
800-723-1763 | 509-335-3006 (fax) | ext.pubs@wsu.edu
Oregon State University Extension Service
https://catalog.extension.oregonstate.edu
800-561-6719 | 541-737-0817 (fax) | puborders@oregonstate.edu
PNW 738 | Published April 2020 | © 2022 by the University of Idaho


